Working with Data objects#
If you are using the IPython terminal in the Glue application, or if you are writing Python code that uses Glue, you will probably want to interact with data.
Data classes#
The core data container in Glue is the Data class.
Each Data instance can include any number of
n-dimensional components, each represented by the
Component class. The actual data resides in the Component objects. Because of this structure, a
Data object can represent either a table, which is a
collection of 1-d Component objects, or an
n-dimensional dataset, which might include one (but could include more)
n-dimensional Component objects.
Inside Data objects, each
Component is assigned a
ComponentID. However, this is not necessarily a
unique ID for each and every component – instead, different components
representing the same conceptual quantity can be given the same component ID.
Component IDs are central to the linking framework
When using the Glue application, the Data objects are
collected inside a DataCollection.
We can represent this graphically like this:
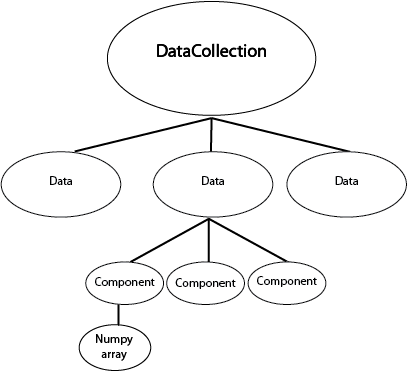
The DataCollection can be accessed by the
dc variable in the IPython terminal. If the Glue application is not open, you can also create your own DataCollection by doing:
>>> from glue.core import DataCollection
>>> dc = DataCollection()
In the remainder of this page, we are going to assume that you have just followed the Getting Started tutorial, and have the Astronomy data on the W5 region loaded.
Alternatively, for the purposes of this tutorial, you can also load the same data manually into a Python/IPython session using:
>>> from glue.core import DataCollection
>>> from glue.core.data_factories import load_data
>>> dc = DataCollection()
>>> dc.append(load_data('getting_started/w5.fits'))
>>> dc.append(load_data('getting_started/w5_psc.vot'))
This sets up the dc object to be the same as what it would be in the
Getting Started tutorial.
Using Data and DataCollection#
Let’s take a look at the DataCollection:
>>> dc
DataCollection (2 data sets)
      0: w5[PRIMARY]
      1: w5_psc
DataCollection behaves like a list – you can access Data objects by indexing them. Let’s grab the first data object:
>>> data = dc[0]
>>> data
Data (label: w5[PRIMARY])
>>> data.components
[Declination, PRIMARY, Pixel x, Pixel y, Right Ascension]
Data objects behave like dictionaries: you can retrieve the numerical data associated with each one with bracket-syntax:
>>> data['PRIMARY']
array([[ 454.47747803,  454.18780518,  454.56842041, ...,  450.08349609,
         451.14971924,  450.25921631],
       ...,
       [ 442.0128479 ,  442.54266357,  443.43310547, ...,  441.5506897 ,
         442.89486694,  442.76904297]], dtype=float32)
Numpy-style fancy-indexing is also supported:
>>> data['PRIMARY', 0:3, 0:2]
array([[ 454.47747803,  454.18780518],
       [ 452.36376953,  452.8883667 ],
       [ 451.77172852,  453.42767334]], dtype=float32)
This is equivalent to:
>>> data['PRIMARY'][0:3, 0:2]
array([[ 454.47747803,  454.18780518],
       [ 452.36376953,  452.8883667 ],
       [ 451.77172852,  453.42767334]], dtype=float32)
Note that the indexing syntax (e.g. ['PRIMARY']) gives you the Numpy array, and not the Component object itself. The Numpy array is usually what you are interested in. However, you can retrieve the Component object if you like. To do this, you will first need to get the ComponentID for the component you are interested in::
>>> primary_id = data.components[0]
>>> primary_id
Declination
>>> type(primary_id)
glue.core.component_id.ComponentID
You can then fetch the component with
get_component():
>>> component = data.get_component(primary_id)
>>> component.data
array([[ 58.84943461,  58.84956411,  58.84969336, ...,  58.84969336,
         58.84956411,  58.84943461],
       ...,
       [ 61.84155834,  61.84170457,  61.84185052, ...,  61.84185052,
         61.84170457,  61.84155834]])
Note
The item access syntax (square brackets) will not work if component labels are not unique. In this case, you must first retrieve the wanted ComponentID and use it to get the component object.
Adding new attributes to datasets#
A common task is to combine two or more attributes in a dataset, and store the result as a new attribute to visualize. To demonstrate this, let’s use the W5 catalog data:
>>> dc
DataCollection (2 data sets)
      0: w5[PRIMARY]
      1: w5_psc
>>> catalog = dc[1]
We can examine the attributes in this dataset
>>> print(catalog)
Data Set: w5_psc
Number of dimensions: 1
Shape: 17771
Components:
 0) ID
 1) Pixel Axis 0
 2) World 0
 3) RAJ2000
 4) DEJ2000
 5) Jmag
 6) Hmag
 7) Ksmag
 ...
As mentioned in Using Data and DataCollection, Data
objects behave like dictionaries mapping component names to numpy arrays. So
one way to define a new component is like this:
>>> j_minus_h = catalog['Jmag'] - catalog['Hmag']
>>> catalog['jmh'] = j_minus_h
If you are using the Glue application, this new attribute is immediately available for visualizing.
Using lazy attributes#
In the procedure above, the j_minus_h array was precomputed. An alternative
approach is to define a new attribute that gets evaluated on-the-fly. While
data[attribute_name] returns a numpy array, data.id[attribute_name]
returns a ComponentID, which you can use as a
lightweight proxy object that you can use to build simple arithmetic
expressions:
>>> jmh_lazy = catalog.id['Jmag'] - catalog.id['Hmag']
>>> jmh_lazy
<BinaryComponentLink: (Jmag - Hmag)>
>>> catalog['jmh2'] = jmh_lazy
This new component is computed as needed on the fly, and can be more memory efficient for particular applications.
Defining new subsets#
You can define new subsets from Python. An example might look like:
>>> state = catalog.id['Jmag'] > catalog.id['Hmag']
>>> label = 'J > H'
>>> subset_group = dc.new_subset_group(label, state)
If you using the Glue application, you can then change the visual properties of this subset using:
>>> subset_group.style.color = '#00ff00'
Note
subset_group is not technically a subset, but a group of subsets.
This is beyond the scope of this tutorial, and explained in more
detail in The selection/subset framework
This method of creating subsets can be a powerful technique. For a demo of using sending Scikit-learn-identified clusters back into Glue as subsets, see this notebook.
The following example demonstrates how to access subsets defined graphically in data viewers. Let’s say that you have two subsets that you defined in the scatter plot and histogram data viewers:
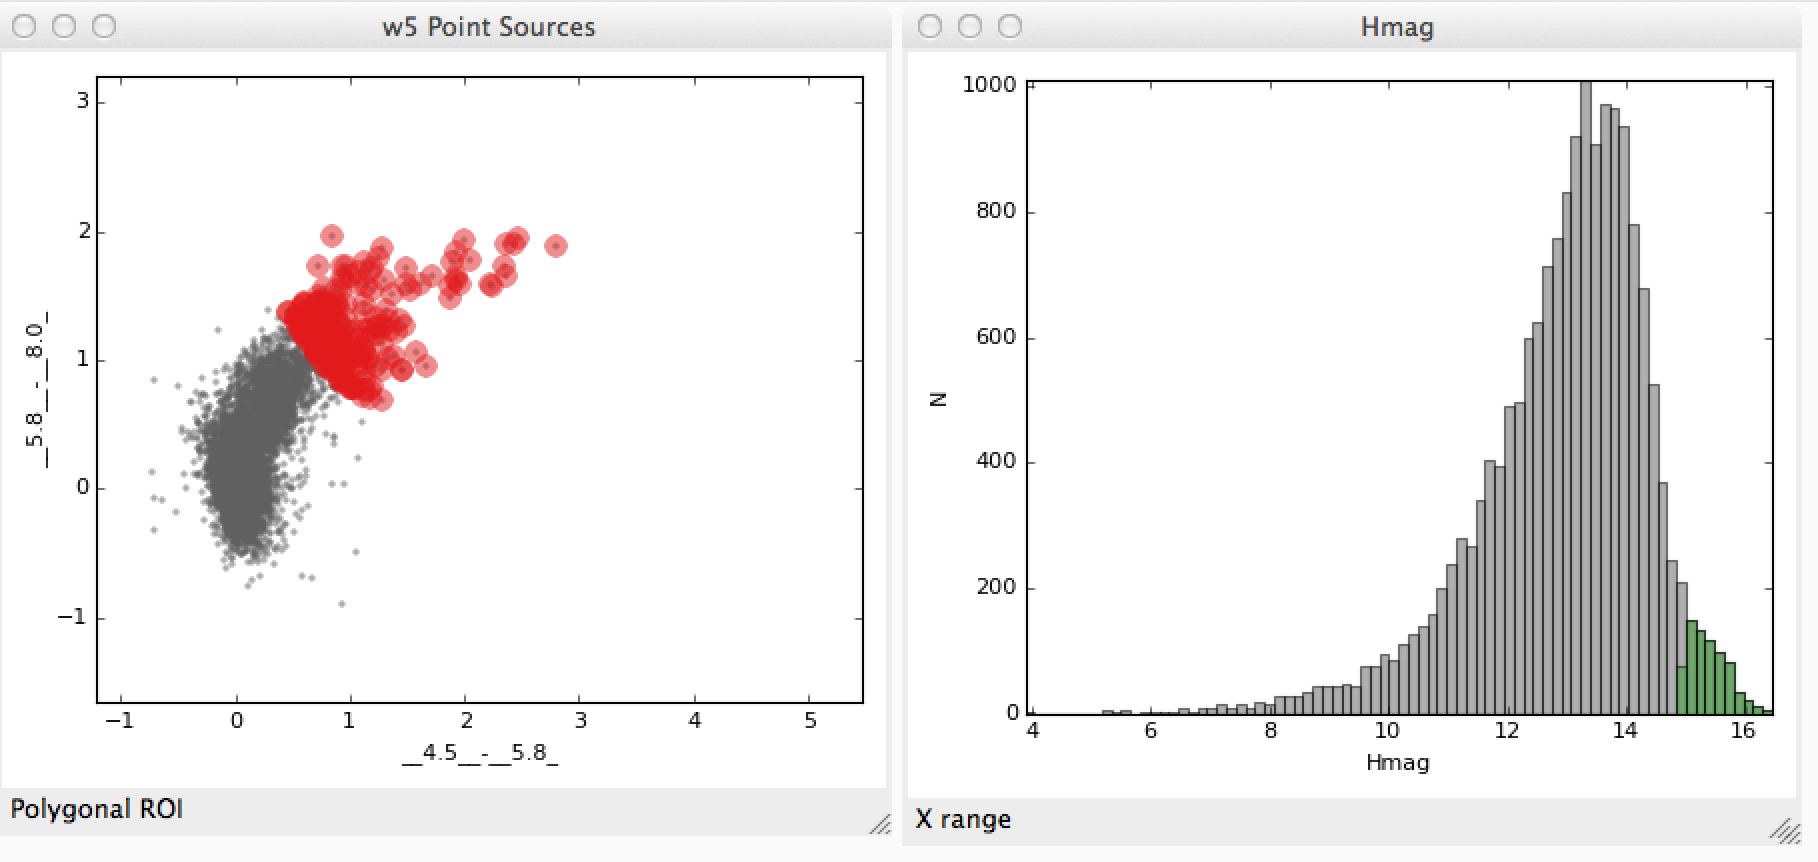
We’ll assume that you made a similar selection to these for demonstration purposes. You can now access the subsets from the built-in IPython console. To do this, assuming you have two subsets defined, you can do:
>>> red, faint_h = dc.subset_groups
Let’s also grab a component in the data:
>>> hmag = catalog.id['Hmag']
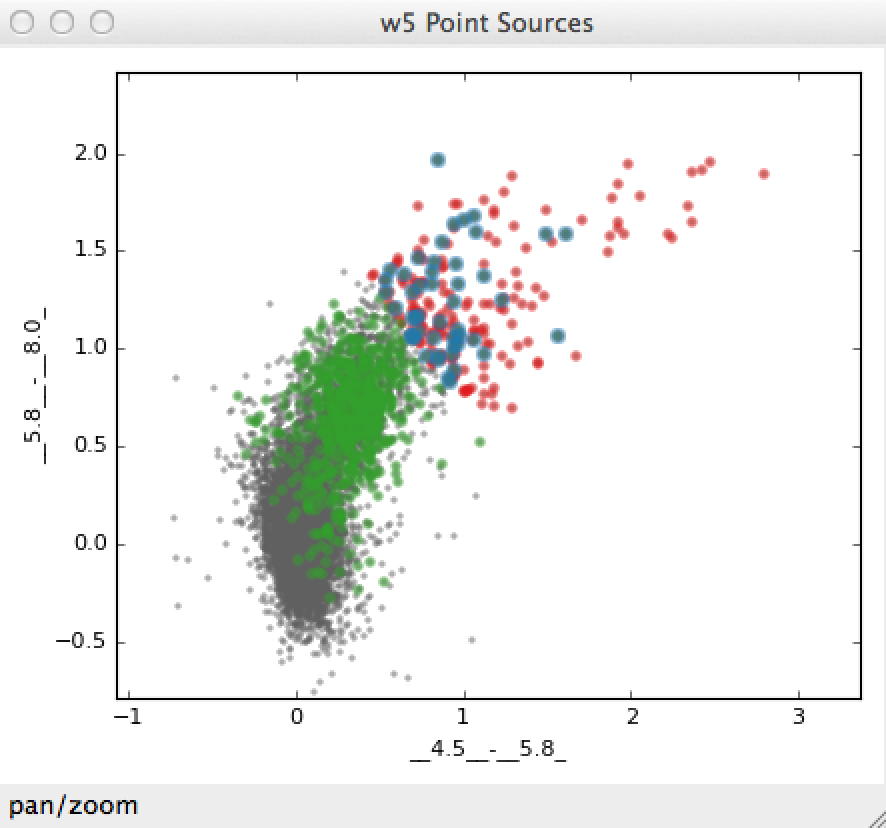
To find the intersection of the two subsets we have already defined (i.e., red sources with faint H band magnitudes):
>>> new_state = red & faint_h
>>> label = "Red and faint"
>>> data_collection.new_subset_group(label=label, subset_state=new_state)
The resulting intersection is shown in blue here:
The boolean operators &, ^, |, and ~ act on subsets to define
new subsets represented by the intersection, exclusive union, union, and
inverse, respectively.
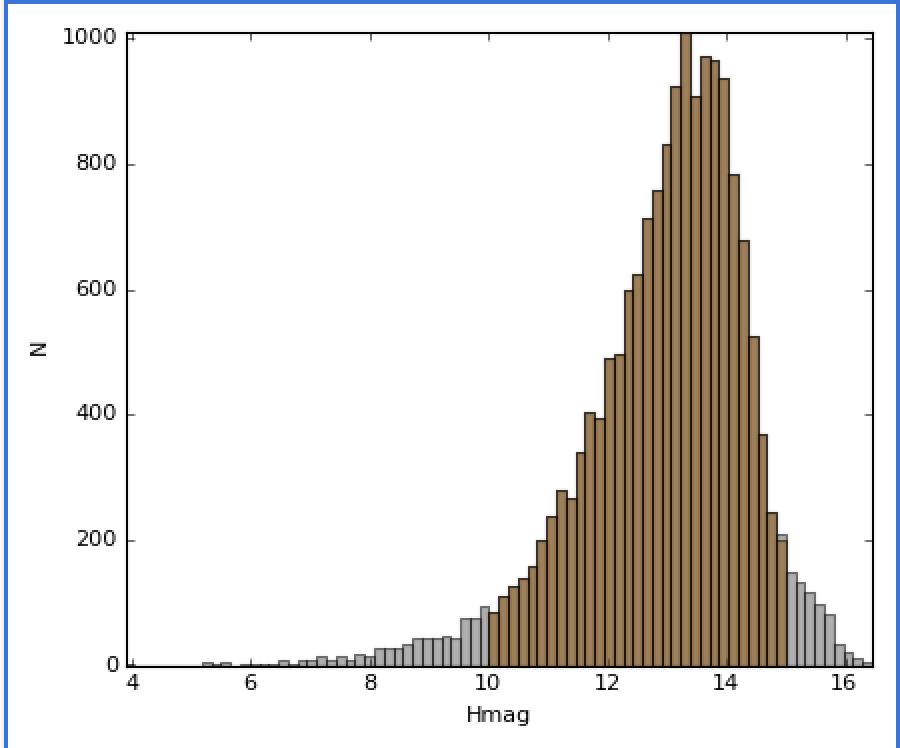
You can also build subsets out of inequality constraints on component IDs:
>>> mid_mag = (hmag > 10) & (hmag < 15)
>>> dc.new_subset_group('between_10_15', mid_mag)
This selects objects with H band magnitudes between 10 and 15:
Accessing subset data#
Once you have defined subsets, you can access the subsets on specific datasets using the .subsets attribute on Data objects. For instance, after the above selections, you might have something that looks like this:
>>> catalog.subsets
(Subset: between_10_15 (data: w5_psc), Subset: J > H (data: w5_psc))
Let’s access the first subset:
>>> subset = catalog.subsets[0]
>>> subset
Subset: between_10_15 (data: w5_psc)
You can access components of the subset as if it was a dataset:
>>> subset['Jmag']
array([ 15.34000015,  10.89999962,  13.30000019, ...,  13.06000042,
        13.38000011,  14.18000031], dtype=float32)
In this case, only the values in the selection are returned. If you prefer, you can also retrieve the subset as a boolean mask that can be applied to the original dataset:
>>> subset.to_mask()
Out[65]: array([ True,  True,  True, ...,  True,  True,  True], dtype=bool)
Creating a data object#
In the above examples, we have assumed that the data objects were loaded via
the Glue application. The readers/writers in Glue can also be accessed using
the functions in glue.core.data_factories:
>>> from glue.core.data_factories import (load_data, fits_reader,
...                                       tabular_data)
>>> fits_reader('image.fits')  # reads a FITS image
>>> load_data('catalog.csv', factory=tabular_data) # reads a catalog
>>> load_data('catalog.csv')  # guesses format
If these functions do not fit your needs, you can also write your own data loader, and use it from the Glue GUI.
It is also possible to create Data objects completely manually:
>>> from glue.core import Data
>>> data = Data(x=[1, 2, 3], y=[2, 3, 4], label="first dataset")
The arguments to the class are the components you want to create, as well as
a label/name for the dataset. Each component can be given using the
name=values syntax. The above example creates a
Data with two components x and y.
You can then add the data object to the data collection using:
>>> dc.append(data)