Writing a custom viewer for glue with Qt#
In Writing a custom viewer for glue, we looked at the basics of building data viewers for glue. In this follow-up tutorial, we look at specifically how to use this to build a data viewer for the Qt front-end of glue.
Options widgets#
We mentioned in Writing a custom viewer for glue that there are state classes that contain a conceptual representation of the overall viewer options and the settings pertaining to each layer in the visualization. What is now needed are widgets that will allow users to easily change this state, and also reflect changes to the state that are made programmatically.
In the Qt version of glue, viewers typically define a widget to control the viewer state, which is usually shown is the area indicated as C in the following diagram:
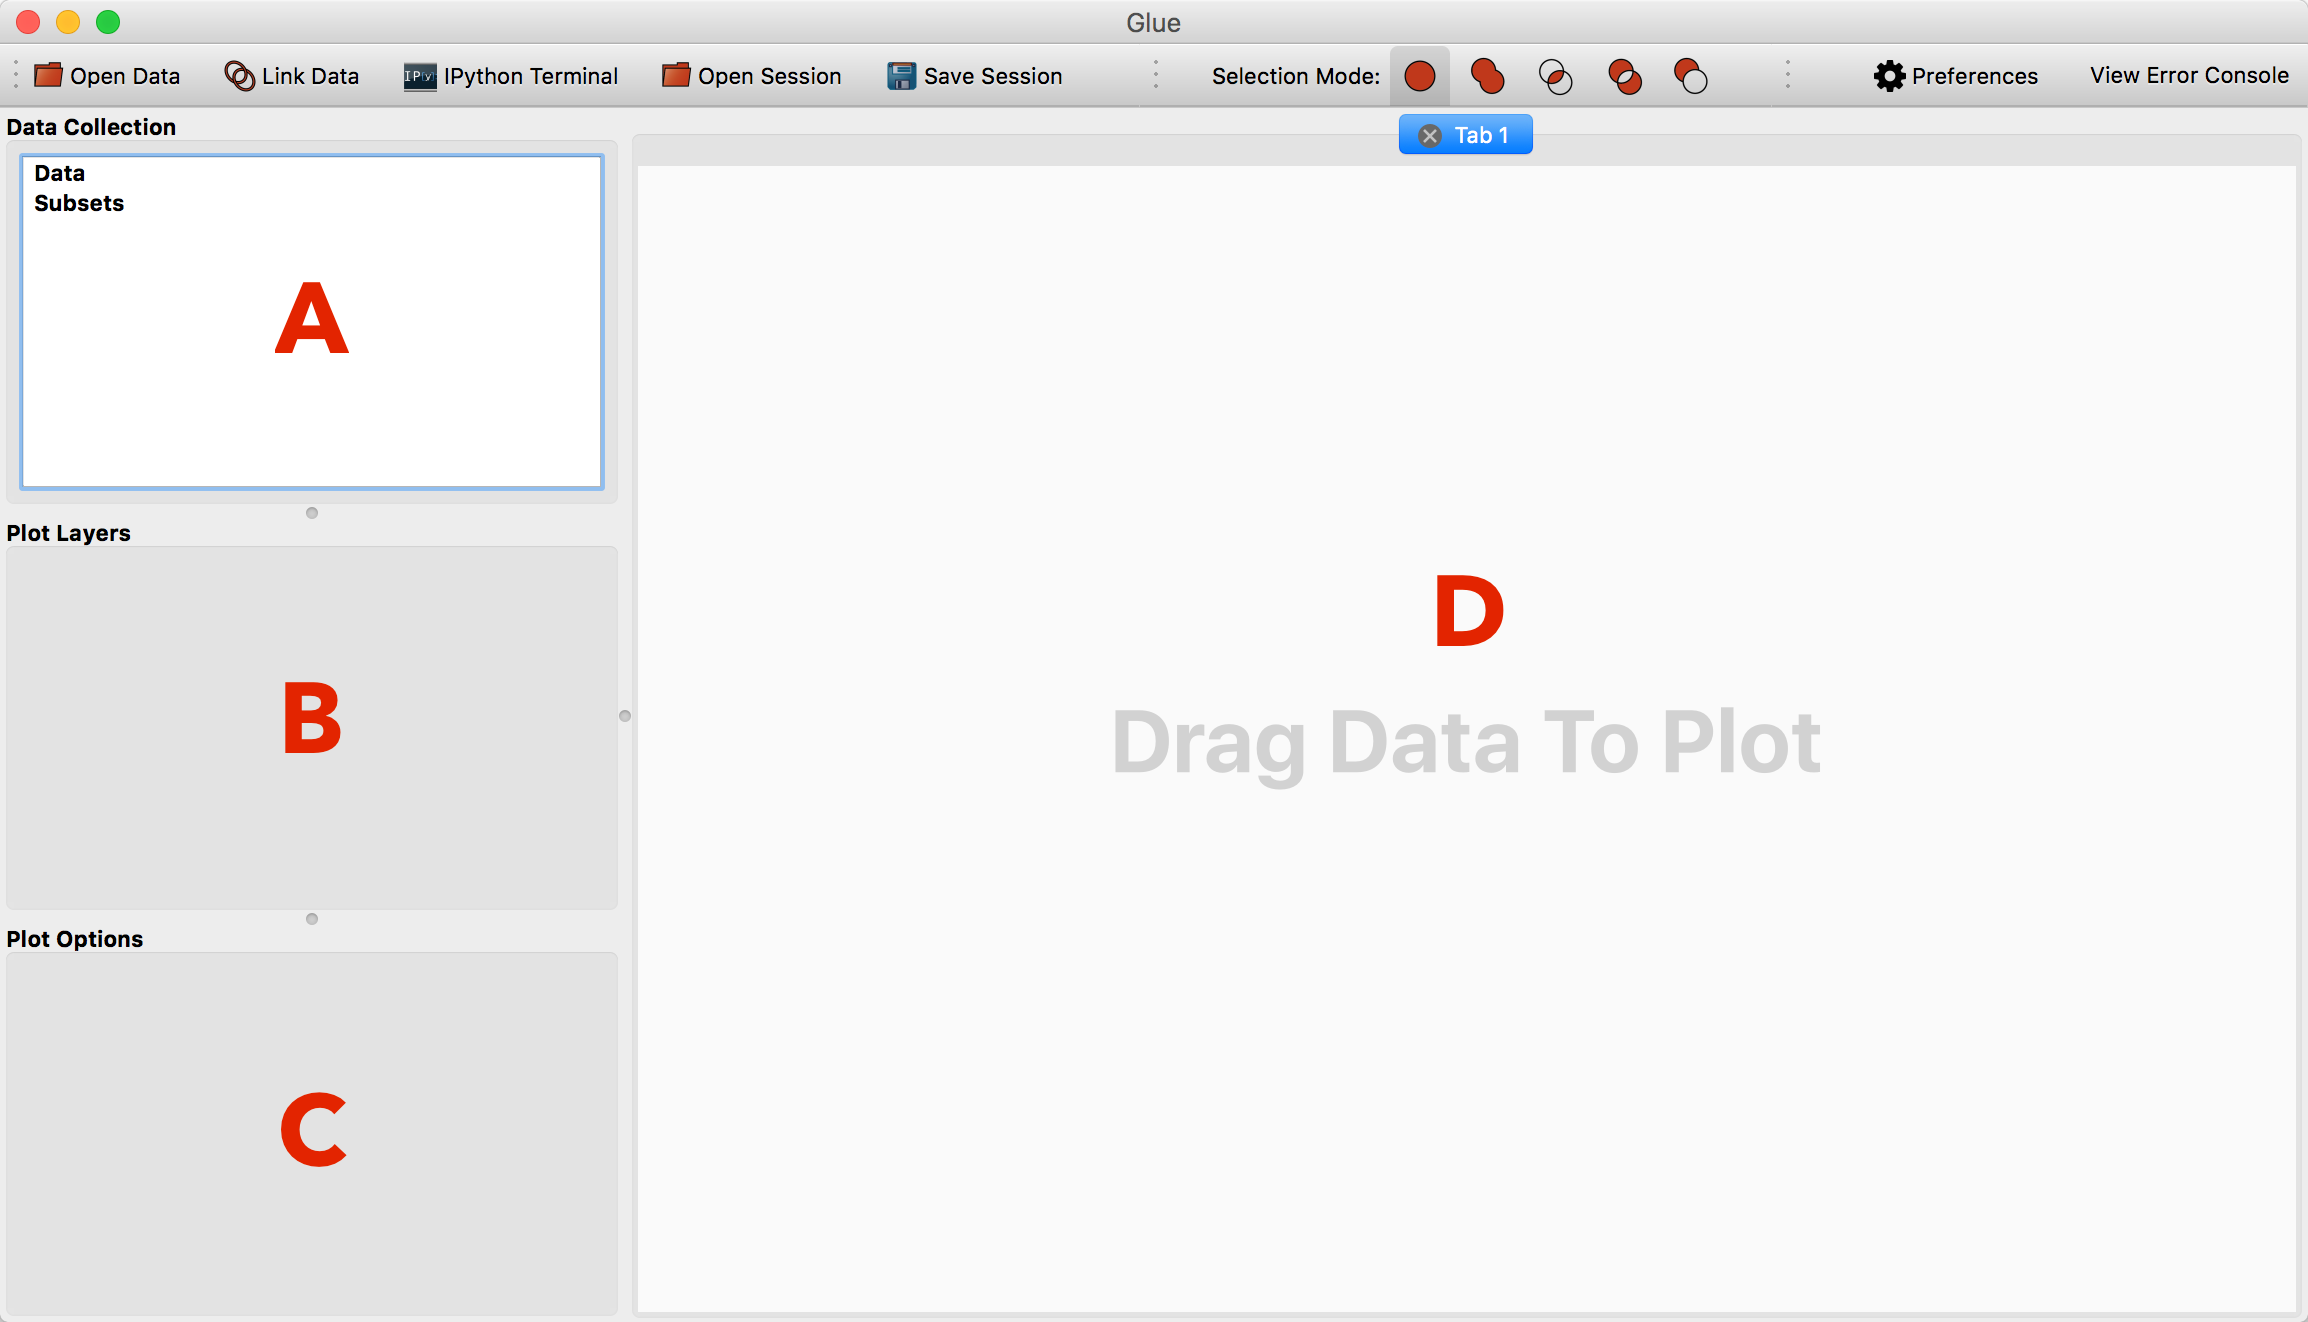
and a widget to control the layer state, which is usually shown is the area indicated as B in the above diagram (in addition to the layer list).
The only requirement for these widgets is that the widget for the viewer options
should take an argument which is the viewer state (as well as a session
keyword argument which is a Session object that
contains a reference to the data collection and hub), and the widget for the
layer settings should take an argument which is the layer artist (in future this
will likely be changed to the layer state), but beyond this, you can implement
the widgets any way you like. Let’s take the simple layer state example above
with the fill option. You could implement a layer options widget by doing:
from echo.qt import connect_checkable_button
from qtpy.QtWidgets import QWidget, QVBoxLayout, QCheckBox

class TutorialLayerStateWidget(QWidget):

     def __init__(self, layer_artist):

         super(LayerEditWidget, self).__init__()

         self.checkbox = QCheckBox('Fill markers')
         layout = QVBoxLayout()
         layout.addWidget(self.checkbox)
         self.setLayout(layout)

         self.layer_state = layer_artist.state
         self._connection = connect_checkable_button(self.layer_state, 'fill', self.checkbox)
In the above example, you can see that we use the
connect_checkable_button function to link the
fill property from the layer state with the checkbox. For a full list of
available functions, see here.
For more complex cases, you may want to use Qt Designer to create a ui file with
your layout (such as viewer_state.ui), then load it
into the options widget - you can then also automatically connect UI elements to
state properties using the
autoconnect_callbacks_to_qt() function. Let’s use
this to create a widget to control the viewer state:
from echo.qt import autoconnect_callbacks_to_qt
from qtpy.QtWidgets import QWidget
from glue_qt.utils import load_ui

class TutorialViewerStateWidget(QWidget):

     def __init__(self, viewer_state, session=None):

         super(TutorialViewerStateWidget, self).__init__()

         # The dirname= is used to indicate that the .ui file is in the same
         # directory as the present file.
         self.ui = load_ui('options_widget.ui', dirname=os.path.dirname(__file__))

         self.viewer_state = viewer_state
         self._connections = autoconnect_callbacks_to_qt(self.viewer_state, self.ui)
For autoconnect_callbacks_to_qt() to work, you need
to follow certain naming conventions for the UI elements in the .ui file. You
can read up more about this convention here.
Data viewer#
In the case of Qt, defining a data viewer is similar to the general case
described in Writing a custom viewer for glue but this time we need to use the
DataViewer class from glue_qt.viewers.common.data_viewer and define
two additional attributes to point to the widgets that control the viewer
and layer state:
from glue_qt.viewers.common.data_viewer import DataViewer

class TutorialDataViewer(DataViewer):

    LABEL = 'Tutorial viewer'
    _state_cls = TutorialViewerState
    _data_artist_cls = TutorialLayerArtist
    _subset_artist_cls = TutorialLayerArtist

    # Additional attributes for Qt viewers
    _options_cls = TutorialViewerStateWidget
    _layer_style_widget_cls = TutorialLayerStateWidget
As mentioned previously, you will need to set up the actual visualization in the
__init__ method for the data viewer, and this time you should use the
setCentralWidget method to add your custom Qt visualization to the widget,
e.g.:
from matplotlib import pyplot as plt

def __init__(self, *args, **kwargs):
    super(TutorialDataViewer, self).__init__(*args, **kwargs)
    self.axes = plt.subplot(1, 1, 1)
    self.setCentralWidget(self.axes.figure.canvas)
Functional example#
Let’s now take all these pieces and construct a functional example. To try this
out you can simply copy the code below into a config.py file in the
directory from where you are starting glue. In addition you will also need the
viewer_state.ui file. In File layout
in glue we discuss how this code are split into different files in glue.
Note that if you are interested in building a Matplotlib-based viewer, you can
make use of the glue.viewers.matplotlib sub-package to simplify things
as described in Writing a custom viewer for glue with Qt and Matplotlib.
import os

import numpy as np
import matplotlib
matplotlib.use('Qt5Agg')
from matplotlib import pyplot as plt
from qtpy.QtWidgets import QWidget, QVBoxLayout, QCheckBox

from glue_qt.config import qt_client
from glue.core.data_combo_helper import ComponentIDComboHelper

from echo import CallbackProperty, SelectionCallbackProperty
from echo.qt import connect_checkable_button, autoconnect_callbacks_to_qt

from glue.viewers.common.layer_artist import LayerArtist
from glue.viewers.common.state import ViewerState, LayerState
from glue.viewers.common.data_viewer import DataViewer

from glue.utils import load_ui


class TutorialViewerState(ViewerState):

    x_att = SelectionCallbackProperty(docstring='The attribute to use on the x-axis')
    y_att = SelectionCallbackProperty(docstring='The attribute to use on the y-axis')

    def __init__(self, *args, **kwargs):
        super(TutorialViewerState, self).__init__(*args, **kwargs)
        self._x_att_helper = ComponentIDComboHelper(self, 'x_att')
        self._y_att_helper = ComponentIDComboHelper(self, 'y_att')
        self.add_callback('layers', self._on_layers_change)

    def _on_layers_change(self, value):
        # self.layers_data is a shortcut for
        # [layer_state.layer for layer_state in self.layers]
        self._x_att_helper.set_multiple_data(self.layers_data)
        self._y_att_helper.set_multiple_data(self.layers_data)


class TutorialLayerState(LayerState):
    fill = CallbackProperty(False, docstring='Whether to show the markers as filled or not')


class TutorialLayerArtist(LayerArtist):

    _layer_state_cls = TutorialLayerState

    def __init__(self, axes, *args, **kwargs):

        super(TutorialLayerArtist, self).__init__(*args, **kwargs)

        self.axes = axes

        self.artist = self.axes.plot([], [], 'o', color=self.state.layer.style.color)[0]

        self.state.add_callback('fill', self._on_fill_change)
        self.state.add_callback('visible', self._on_visible_change)
        self.state.add_callback('zorder', self._on_zorder_change)

        self._viewer_state.add_callback('x_att', self._on_attribute_change)
        self._viewer_state.add_callback('y_att', self._on_attribute_change)

    def _on_fill_change(self, value=None):
        if self.state.fill:
            self.artist.set_markerfacecolor(self.state.layer.style.color)
        else:
            self.artist.set_markerfacecolor('none')
        self.redraw()

    def _on_visible_change(self, value=None):
        self.artist.set_visible(self.state.visible)
        self.redraw()

    def _on_zorder_change(self, value=None):
        self.artist.set_zorder(self.state.zorder)
        self.redraw()

    def _on_attribute_change(self, value=None):

        if self._viewer_state.x_att is None or self._viewer_state.y_att is None:
            return

        x = self.state.layer[self._viewer_state.x_att]
        y = self.state.layer[self._viewer_state.y_att]

        self.artist.set_data(x, y)

        self.axes.set_xlim(np.nanmin(x), np.nanmax(x))
        self.axes.set_ylim(np.nanmin(y), np.nanmax(y))

        self.redraw()

    def clear(self):
        self.artist.set_visible(False)

    def remove(self):
        self.artist.remove()

    def redraw(self):
        self.axes.figure.canvas.draw_idle()

    def update(self):
        self._on_fill_change()
        self._on_attribute_change()


class TutorialViewerStateWidget(QWidget):

    def __init__(self, viewer_state=None, session=None):

        super(TutorialViewerStateWidget, self).__init__()

        self.ui = load_ui('viewer_state.ui', self,
                          directory=os.path.dirname(__file__))

        self.viewer_state = viewer_state
        self._connections = autoconnect_callbacks_to_qt(self.viewer_state, self.ui)


class TutorialLayerStateWidget(QWidget):

    def __init__(self, layer_artist):

        super(TutorialLayerStateWidget, self).__init__()

        self.checkbox = QCheckBox('Fill markers')
        layout = QVBoxLayout()
        layout.addWidget(self.checkbox)
        self.setLayout(layout)

        self.layer_state = layer_artist.state
        self._connection = connect_checkable_button(self.layer_state, 'fill', self.checkbox)


class TutorialDataViewer(DataViewer):

    LABEL = 'Tutorial viewer'
    _state_cls = TutorialViewerState
    _options_cls = TutorialViewerStateWidget
    _layer_style_widget_cls = TutorialLayerStateWidget
    _data_artist_cls = TutorialLayerArtist
    _subset_artist_cls = TutorialLayerArtist

    def __init__(self, *args, **kwargs):
        super(TutorialDataViewer, self).__init__(*args, **kwargs)
        self.axes = plt.subplot(1, 1, 1)
        self.setCentralWidget(self.axes.figure.canvas)

    def get_layer_artist(self, cls, layer=None, layer_state=None):
        return cls(self.axes, self.state, layer=layer, layer_state=layer_state)


qt_client.add(TutorialDataViewer)
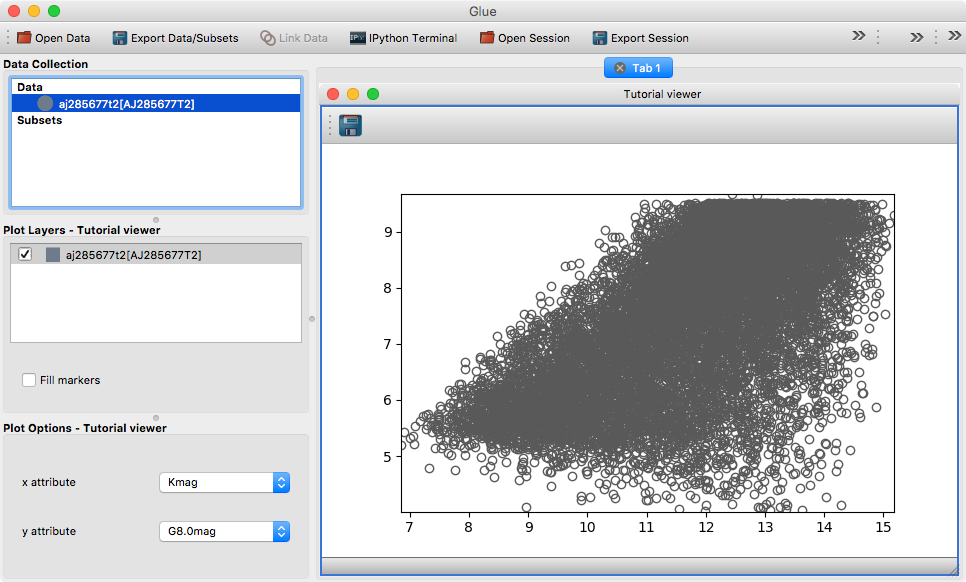
Try opening a tabular dataset in glue, drag it onto the canvas area, and select Tutorial viewer - you should now get something that looks like:
File layout in glue#
In glue, we split up the classes using the following layout:
Filename |
Description |
|---|---|
|
State classes for the viewer and layer |
|
Layer artist class |
|
Qt ui file for the viewer state widget |
|
Qt viewer state widget |
|
Qt ui file for the layer state widget |
|
Qt layer state widget |
|
Qt data viewer |
You are of course free to organize the files how you wish, but this should help understand the existing viewers in glue if needed.
Further reading#
To find out how to add tools to your custom viewer, see the Custom tools for viewers and custom toolbars tutorial, and for information on building a data viewer with Matplotlib, take a look at the Writing a custom viewer for glue with Qt and Matplotlib tutorial.