Writing a custom viewer for glue with Qt and Matplotlib#
If you are a user trying to build a very simple viewer using Matplotlib, you may want to check out Writing a simple custom data viewer – the present tutorial is intended for people who wish to write and distribute a viewer using Matplotlib with full control over layout and behavior. This tutorial assumes that you have already gone over the Writing a custom viewer for glue and Writing a custom viewer for glue with Qt tutorials.
Glue provides a set of base classes for the state classes, layer artist, and data viewer which already take care of a number of aspects common to all Matplotlib-based viewers. We describe each of these in turn in the following sections, then simplify the example from Writing a custom viewer for glue with Qt using this infrastructure.
State classes#
The MatplotlibDataViewerState class
provides a subclass of ViewerState which
adds properties related to:
the appearance of the plot (font and tick sizes)
the limits of the current view (this currently assumes 2D plots)
the aspect ratio of the axes
whether the axes are log or linear
Note that it does not add e.g. x_att and y_att since not all Matplotlib-
based viewers will require the same number of attributes, and since some viewers
may define attributes that aren’t specific to the x or y axis (e.g. in the case
of networks).
The MatplotlibLayerState class
provides a subclass of LayerState which
adds the color and alpha property (and keeps them in sync with
layer.style.color and layer.style.alpha).
Layer artist#
The MatplotlibLayerArtist class
implements the
redraw(),
remove(), and
clear()
methods assuming that all the contents of the layer use Matplotlib artists. In
the __init__ of your
MatplotlibLayerArtist sub-class,
you should make sure you add all artist references to the mpl_artists
property for this to work.
Data viewer#
The MatplotlibDataViewer class
adds functionality on top of the base
DataViewer
class:
It automatically sets up the Matplotlib axes
It keeps the x/y limits of the plot, the scale (linear/log), the font/tick parameters, and the aspect ratio in sync with the
MatplotlibDataViewerStateIt adds tools for saving, zooming, panning, and resetting the view
It recognizes the global glue preferences for foreground/background color
Functional example#
Let’s now take the take full example from Writing a custom viewer for glue with Qt and
update/improve it to use the infrastructure described above. As before if you
want to try this out, you can copy the code below into a file called
config.py in the directory from where you are starting glue. In addition you
will also need the viewer_state.ui
file.
import os

import numpy as np

from qtpy.QtWidgets import QWidget, QVBoxLayout, QCheckBox

from glue_qt.config import qt_client
from glue.core.data_combo_helper import ComponentIDComboHelper

from echo import CallbackProperty, SelectionCallbackProperty
from echo.qt import (connect_checkable_button,
                                   autoconnect_callbacks_to_qt)

from glue.viewers.matplotlib.layer_artist import MatplotlibLayerArtist
from glue.viewers.matplotlib.state import MatplotlibDataViewerState, MatplotlibLayerState
from glue_qt.viewers.matplotlib.data_viewer import MatplotlibDataViewer

from glue_qt.utils import load_ui


class TutorialViewerState(MatplotlibDataViewerState):

    x_att = SelectionCallbackProperty(docstring='The attribute to use on the x-axis')
    y_att = SelectionCallbackProperty(docstring='The attribute to use on the y-axis')

    def __init__(self, *args, **kwargs):
        super(TutorialViewerState, self).__init__(*args, **kwargs)
        self._x_att_helper = ComponentIDComboHelper(self, 'x_att')
        self._y_att_helper = ComponentIDComboHelper(self, 'y_att')
        self.add_callback('layers', self._on_layers_change)
        self.add_callback('x_att', self._on_attribute_change)
        self.add_callback('y_att', self._on_attribute_change)

    def _on_layers_change(self, value):
        self._x_att_helper.set_multiple_data(self.layers_data)
        self._y_att_helper.set_multiple_data(self.layers_data)

    def _on_attribute_change(self, value):
        if self.x_att is not None:
            self.x_axislabel = self.x_att.label
        if self.y_att is not None:
            self.y_axislabel = self.y_att.label


class TutorialLayerState(MatplotlibLayerState):
    fill = CallbackProperty(False, docstring='Whether to show the markers as filled or not')


class TutorialLayerArtist(MatplotlibLayerArtist):

    _layer_state_cls = TutorialLayerState

    def __init__(self, axes, *args, **kwargs):

        super(TutorialLayerArtist, self).__init__(axes, *args, **kwargs)

        self.artist = self.axes.plot([], [], 'o', mec='none')[0]
        self.mpl_artists.append(self.artist)

        self.state.add_callback('fill', self._on_visual_change)
        self.state.add_callback('visible', self._on_visual_change)
        self.state.add_callback('zorder', self._on_visual_change)
        self.state.add_callback('color', self._on_visual_change)
        self.state.add_callback('alpha', self._on_visual_change)

        self._viewer_state.add_callback('x_att', self._on_attribute_change)
        self._viewer_state.add_callback('y_att', self._on_attribute_change)

    def _on_visual_change(self, value=None):

        self.artist.set_visible(self.state.visible)
        self.artist.set_zorder(self.state.zorder)
        self.artist.set_markeredgecolor(self.state.color)
        if self.state.fill:
            self.artist.set_markerfacecolor(self.state.color)
        else:
            self.artist.set_markerfacecolor('white')
        self.artist.set_alpha(self.state.alpha)

        self.redraw()

    def _on_attribute_change(self, value=None):

        if self._viewer_state.x_att is None or self._viewer_state.y_att is None:
            return

        x = self.state.layer[self._viewer_state.x_att]
        y = self.state.layer[self._viewer_state.y_att]

        self.artist.set_data(x, y)

        self.axes.set_xlim(np.nanmin(x), np.nanmax(x))
        self.axes.set_ylim(np.nanmin(y), np.nanmax(y))

        self.redraw()

    def update(self):
        self._on_attribute_change()
        self._on_visual_change()


class TutorialViewerStateWidget(QWidget):

    def __init__(self, viewer_state=None, session=None):

        super(TutorialViewerStateWidget, self).__init__()

        self.ui = load_ui('viewer_state.ui', self,
                          directory=os.path.dirname(__file__))

        self.viewer_state = viewer_state
        self._connections = autoconnect_callbacks_to_qt(self.viewer_state, self.ui)


class TutorialLayerStateWidget(QWidget):

    def __init__(self, layer_artist):

        super(TutorialLayerStateWidget, self).__init__()

        self.checkbox = QCheckBox('Fill markers')
        layout = QVBoxLayout()
        layout.addWidget(self.checkbox)
        self.setLayout(layout)

        self.layer_state = layer_artist.state
        self._connection = connect_checkable_button(self.layer_state, 'fill', self.checkbox)


class TutorialDataViewer(MatplotlibDataViewer):

    LABEL = 'Tutorial viewer'
    _state_cls = TutorialViewerState
    _options_cls = TutorialViewerStateWidget
    _layer_style_widget_cls = TutorialLayerStateWidget
    _data_artist_cls = TutorialLayerArtist
    _subset_artist_cls = TutorialLayerArtist


qt_client.add(TutorialDataViewer)
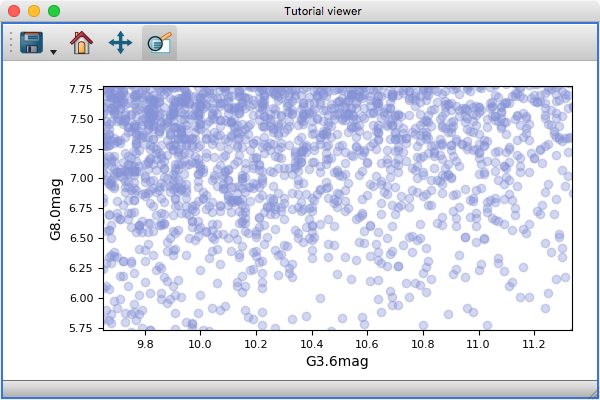
While the code is not much shorter, there is additional functionality available. In particular, the viewer now has standard Matplotlib buttons in the toolbar:
In addition, the layer artist has been improved to take into account the color
and transparency given by the layer state (via the _on_visual_change
method), and the axis labels are now set in the viewer state class.
Further reading#
To find out how to add tools to your custom viewer, see the Custom tools for viewers and custom toolbars tutorial.