Spectrum Analysis
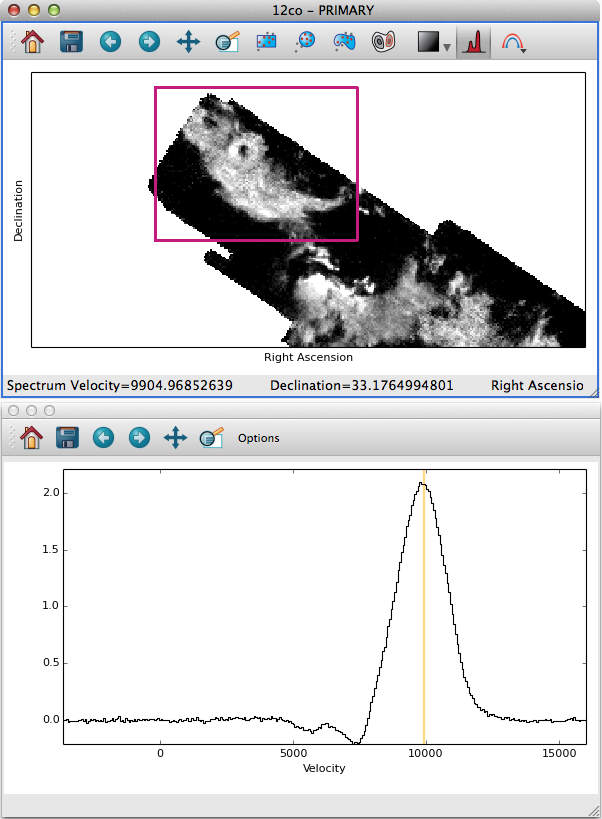
When using the image viewer on data with 3 or more dimensions, you have the option of extracting and analyzing spectra (or, more generally, integrated 1D profiles). To extract a spectrum, click the profile button on an image viewer:

Then, click-drag a box on the image. Glue will extract a spectrum by integrating over the dimensions of the box, for each slice of the cube. Likewise, you can also drag a subset onto the spectrum window, to extract a spectrum for the pixels in that subset.
The spectrum is displayed in a new window, which you can interact with in a few ways.
Interaction Modes
Cube Collapse
Click on the options button of the spectrum window, and then select the collapse tab. This allows you to partially collapse the cube, and send the result back to the image viewer. The two-sided handle on the plot defines the slices to collapse over, which you can edit by dragging the edges.
Profile Fitting
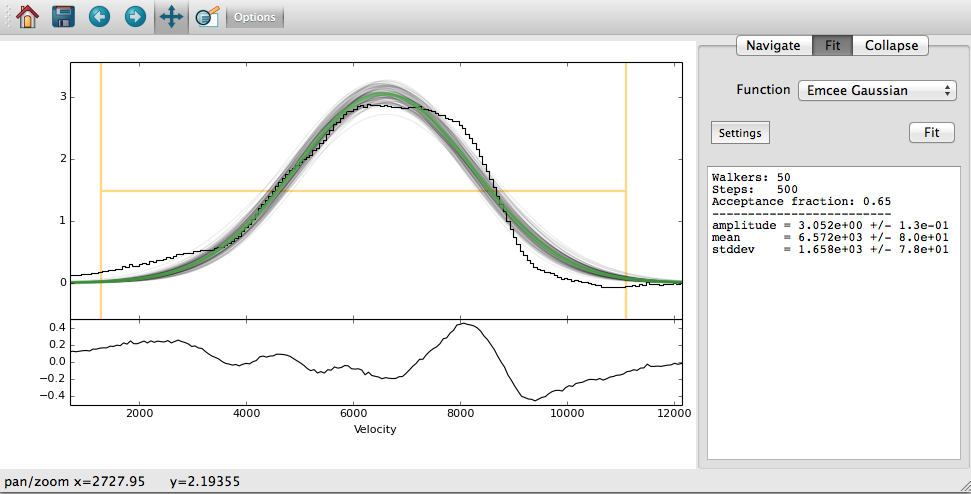
By clicking on the fit tab, you can fit a model to the extracted spectrum. Again, the two sided handle on the plot defines the range of data to fit. Clicking the fit button will add a best-fit model to the plot. The dropdown lets you choose which model to fit to the data.
Different models have different settings, which you can adjust by clicking on the settings button. For example, the (astropy-powered) Gaussian fitter allows you to fix certain parameters, or limit them to specific ranges.
Custom fitting plugins
The profile fitting tool is designed to be easily extended, so that you can plug in your own model fitting code worrying about GUI code. We will walk through several examples of custom fitting plugins, to demonstrate the various features of the plugin system.
Simple line fitter
Our first example is a simple linear model. Here’s the code:
1 2 3 4 5 6 7 8 9 10 11 12 13 14 | from glue.core.fitters import BaseFitter1D
from glue.config import fit_plugin
import numpy as np
@fit_plugin
class LineFit(BaseFitter1D):
label = "Line"
def fit(self, x, y, dy, constraints):
return np.polyfit(x, y, 1)
def predict(self, fit_result, x):
return np.polyval(fit_result, x)
|
Let’s look at this line by line:
Line 6 wraps a subclass of BaseFitter1D in the fit_plugin decorator.
All plugins follow this basic structure.
Line 8 gives this class a label, which is used in the GUI to label this model in the model selection dropdown.
Line 10 overrides the fit() method. All plugins must implement fit, which
takes at least 4 parameters:
- x: A numpy array of X values
- y: A numpy array of Y values
- dy: A numpy array of the errors on each Y value, or none
- constraints: A dictionary of constraints (more on this later)
The fit method can do whatever it wants. Here, we are using numpy.polyfit() to fit a 1st-order polynomial to the data. We ignore dy and constraints.
We return the result from polyfit – Glue doesn’t care what fit returns,
it just passes that to other methods (as we will now see)
Line 13 overrides the predict() method. Again, all models must define this method.
It takes 2 inputs – whatever was returned from fit(), and an array of X values
to evaluate the model at. This method must return a array of model-predicted Y
values at each X location. We use numpy.polyval() to do this
This code is enough to let us fit lines to data:
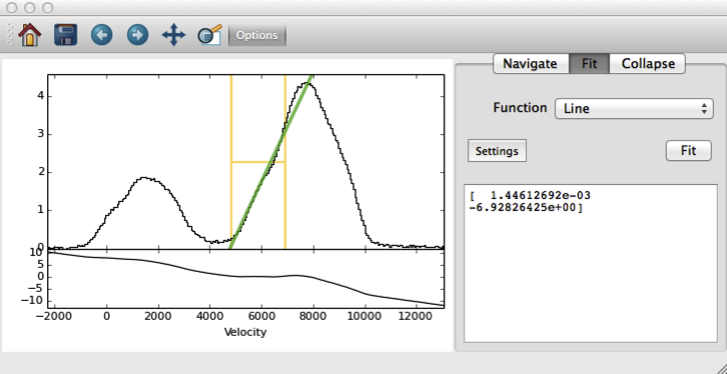
Note
In order for Glue to find this code, we need to copy this file to the same directory as config.py (~/.glue by default), and add import line_fit_plugin to config.py.
Polynomial fitter, with Options
Generalizing the line fitter above to higher degree polynomials is trivial, since polyfit/polyval both handle this case. We might want to make the degree of the fit a user-settable
parameter. We can do this by adding a UI option, and a few keywords to our class:
1 2 3 4 5 6 7 8 9 10 11 12 13 14 15 16 17 18 19 20 | from glue.core.fitters import BaseFitter1D
from glue.core.simpleforms import IntOption
from glue.config import fit_plugin
import numpy as np
@fit_plugin
class PolynomialFitter(BaseFitter1D):
label = "Polynomial"
degree = IntOption(min=0, max=5, default=3, label="Polynomial Degree")
def fit(self, x, y, dy, constraints, degree=2):
return np.polyfit(x, y, degree)
def predict(self, fit_result, x):
return np.polyval(fit_result, x)
def summarize(self, fit_result, x, y, dy=None):
return "Coefficients:\n" + "\n".join("%e" % coeff
for coeff in fit_result.tolist())
|
This code adds a few new features:
Line 10 adds an IntOption named degree to the class. Likewise,
the fit method takes a keyword named degree, and uses this to fit a
polynomial of order degree (e.g., degree=2 corresponds to a parabola).
This extra information allows Glue to add a widget to the settings window:
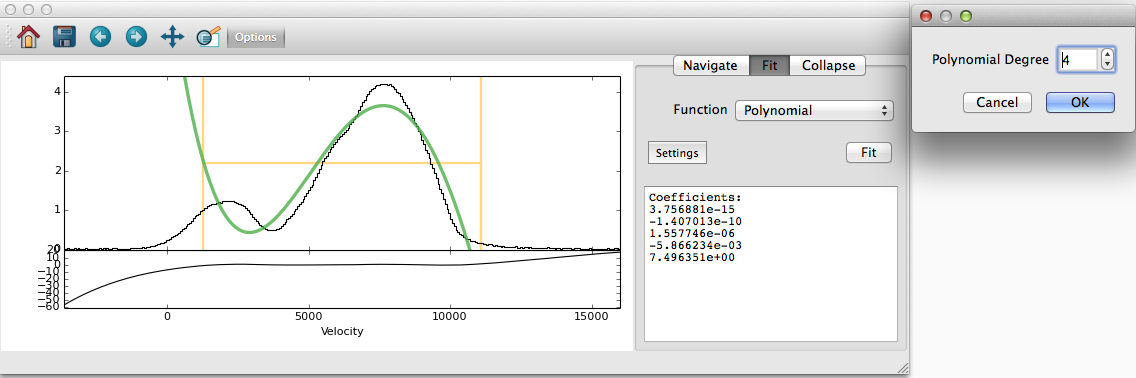
This plugin also overrides the summarize() method. Summarize returns a string, which is used as the display in the fit summary window.
Model with constraints
Models like those found in astropy.modeling support fixing or
constraining certain parameters. If you would like to add user-setttable
constraints to your model, add a param_names list to the class:
class ConstrainedGaussian(BaseFitter1D):
    param_names = ['amplitude']
    ...
Glue uses this information to let the user fix or limit parameters
in the settings tab. This information is passed to the constraints
argument of fit(). constraints is a dictionary whose keys are
parameter names. Each value is itself a dictionary with 4 entries:
- The default
valueof the parameter, or None if not set by the userfixed, which is True if the parameter should be held fixedlimits, which is None if the value is unconstrained, or a list of minimum/maximum allowed values
Astropy-based models
The AstropyFitter1D base class can be subclassed to plug custom astropy models and fitters into Glue. This is very easy:
from astropy.modeling import models, fitting

@fit_plugin
class Gaussian(AstropyFitter1D):
    model_cls = models.Gaussian1D
    fitting_cls = fitting.NonLinearLSQFitter
    label = "Gaussian"

    def parameter_guesses(self, x, y, dy):
        return dict(amplitude=1, stddev=1, mean=1)
The parameter_guesses() method is optional, and provides initial guesses
for the model parameters if they weren’t set by the user.